
Has Immigration Benefitted European Economies?


Contents
Introduction
Summary
Sweden
Denmark
Norway
Finland
Holland
United Kingdom
France
Conclusion
1.Introduction
The immigration and asylum policies implemented in Western Europe, which have brought about significant cultural changes, have been subject to various forms of criticism. However, proponents argue that any perceived disadvantages associated with these policies are offset by the positive economic impacts. In this article, I aim to explore and assess the economic implications of these transformative immigration measures and provide insights into the actual effects of these policies on the labour market, highlighting trends in human capital and overall economic productivity.
2.Summary
• The annual average cost of migrants in Sweden amounts to $10 billion, representing approximately 2.38% of their GDP
• In Denmark, the native Danish population made a total net contribution of +41 billion DKK ($4.5bn), while immigrants and their descendants had a net negative contribution of -24 billion DKK ($3.5bn)
• Migrants from Western countries were consistently identified as positive contributors to Denmark’s economy. Conversely, migrants from MENAPT (Muslim countries) were consistently found to have a negative impact on the economy
• In Norway, 60 percent of working-age individuals from Pakistan and Turkey are unemployed, and their earnings are just one-third of the native average
• As many as 62.5 percent of migrants hailing from Pakistan and Turkey were recipients of such benefits in Norway
• During their lifetime, a single Somali immigrant incurs costs to the Finnish state amounting to nearly 1 million euros
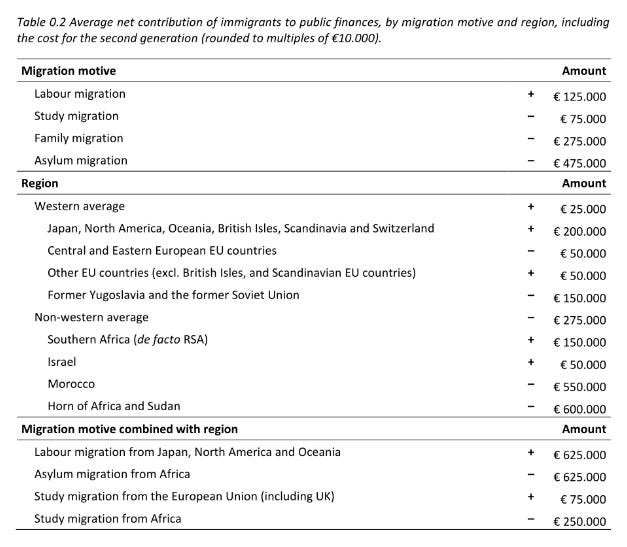
• On average, a single asylum seeker costs the Dutch state €475,000
• In the Netherlands, migrants from Japan, North America, and Oceania were positive contributors of €625,000 while migrants from Africa negatively contributed €625,000 on average
• The total net cost of migrants in the Netherlands between 1995 and 2019 amounted to €400 billion, which is equivalent to the revenue generated from the country's natural gas extraction
• Between the years 1995–2011, immigration cost the UK £114 billion (with non-European Economic Area migrants contributing -£118 billion)
• Migrants from Western countries exhibit higher employment rates compared to native populations in the UK. Conversely, migrants from Africa (excluding South Africa) and Southern Asia have significantly lower employment rates, with only 19.8% of Muslims in full-time employment
• In the UK, migration is more likely to increase wages at the top of the distribution, and reduce wages at the bottom of the distribution
• An increase of 100 foreign-born working-age migrants in the UK was associated with a reduction of 23 natives in employment for the period 1995 to 2010
• The fiscal impact of immigration in the UK, in relation to the overall GDP, is relatively small and therefore cannot serve as a justifiable basis for advocating large-scale immigration
• In France, the economic contribution of immigrants fluctuates within the range of -1% to -1.65% of their GDP over a 30 year period. The negative contribution of immigrants is the reason for the French primary deficit of 1984
3.Sweden
To begin, we will focus on Sweden as a significant case study in the context of the 2015 migrant crisis, for which the Nordic country accepted more migrants per capita than any other in Europe. Despite concerns surrounding issues of crime, rape, and terrorism associated with Sweden's open-door policy, there has been limited discussion of its economic implications.
A recent report highlights that the net tax cost for migrants and migrants' relatives in Sweden reaches an average of $10 billion annually, representing approximately 2.38 percent of their GDP.

Even prior to the migrant crisis, a 2003 study determined that the government incurred a net loss of $20,500 per new immigrant, highlighting the substantial performance gap between natives and migrants.
4.Denmark
According to a 2021 report from Denmark, the analysis revealed that in 2018, the native Danish population made a total net contribution of +41 billion DKK ($4.5bn), while immigrants and their descendants had a net negative contribution of -24 billion DKK ($3.5bn).

The report categorised regions into three distinct groups: Western countries (including Europe, North America, and Oceania), MENAPT countries (encompassing the Middle East, Northern Africa, Pakistan, and Turkey), and Other non-Western countries (such as China, Japan, India, etc.) The findings reveal a discernible pattern, with all Western countries showing positive contributions, Other non-Western migrants exhibiting mixed contributions, and all MENAPT countries demonstrating negative contributions.

5.Norway
A longitudinal analysis from Norway examines the labour market performance and social insurance participation of immigrants from 1970 until 2012.


The above chart shows that natives and European economic area (EEA) migrants have similar levels of employment. Conversely, immigrants from Pakistan and Turkey have seen a steep decline in employment and earnings. Towards the conclusion of the observation period, more than 60 percent of working-age individuals from these regions remained unemployed, and their earnings dwindled to just one-third of the native average.

Regarding social insurance (welfare), a comparable pattern emerges where non-EEA migrants and refugees tend to make significantly more claims than both native-born individuals and EEA migrants. In the context of disability insurance, a striking statistic reveals that as many as 62.5 percent of migrants hailing from Pakistan and Turkey were recipients of such benefits. The study found that migrants originating from countries with comparable income levels to Norway typically exhibit strong performance and a relatively small percentage of these immigrants opt for permanent settlement. Conversely, labour migrants from low-income developing nations tend to establish long-term residency and have high risks of non‐employment and social insurance dependency.
6.Finland
A separate report conducted in Finland reveals noteworthy findings regarding the economic impact of Iraqi and Somali migrants. Specifically, the analysis focuses on the average expenses incurred by Iraqi migrants aged 20-24 years, indicating a cost of €844,000 when they decide to have children. This amount exceeds the average financial burden on Finnish-born families by €1.27 million. Moreover, the study reveals that the lifetime cost to the Finnish state for a single Somali immigrant is nearly 1 million euros.

7.Holland
Over in Holland, a comprehensive examination of immigration data, particularly pertaining to the cost analysis of various migrant groups and asylum seekers, is available from the Amsterdam School of Economics. The study found that the average asylum seeker cost the state €475,000. Moreover, considerable variations in economic contribution were observed across different regions. Migrants originating from Japan, North America, and Oceania were found to be positive contributors, with an average contribution of €625,000. Conversely, migrants from Africa exhibited a negative average contribution of €625,000.
Further analysis of the economic performance of migrant groups revealed a notable trend: first-generation migrants who make positive contributions tend to have children who surpass native individuals in terms of achievement. Using a baseline integration level of 100 percent for the native population, second-generation individuals of Japanese descent scored 128 percent, Chinese descent scored 115 percent, and Scandinavian descent scored 110 percent. On the contrary, immigrants from regions associated with negative economic contributions exhibited the opposite pattern.
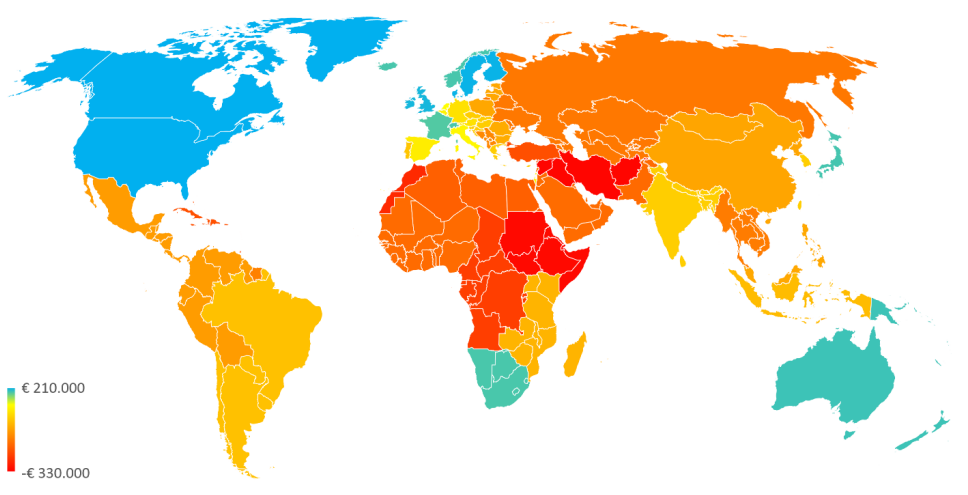
The above map shows the net contribution of first-generation immigrants for 42 regions of origin. These findings align with the data observed in Denmark, indicating that individuals from Western and North East Asian regions make positive economic contributions, while those from Africa and the Middle East tend to have negative economic impacts.
The report concludes that the total net costs of immigration averaged €17 billion per year. Between 1995–2019, the total costs amounted to €400 billion, which is the same amount of revenue generated from Holland’s natural gas extraction. The authors also project that a further €600 billion in costs will occur in the next two decades.
Data from 2022 reveals that despite only making up 17% of the population, non-Western migrants represent the majority of welfare recipients. Therefore, non-Western migrants are 6.35 times more likely to receive benefits than Natives

9.United Kingdom

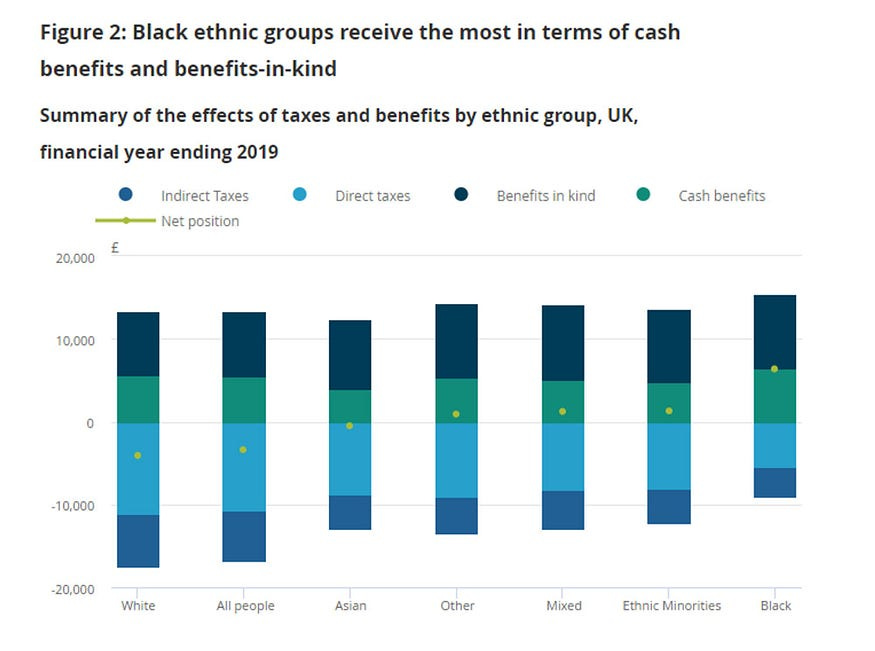
In the United Kingdom, a well-publicised study examined the fiscal impact of immigration on the economy during the period from 1995 to 2011. The findings indicated that migrants from the European Economic Area (EEA) made a positive contribution of £4 billion to the economy, while migrants from outside the European Economic Area (non-EEA) made a negative contribution of £118 billion. The analysis revealed that EEA migrants had slightly higher employment rates compared to native individuals, whereas non-EEA migrants had a lower average employment rate of only 60 percent. It was also observed that immigrants, as a whole, were more likely to reside in social housing, although EEA migrants were less likely to do so, while non-EEA migrants were significantly more likely. These findings are consistent with data from the Office for National Statistics (ONS), which highlights the net position of different ethnic groups in terms of benefits received and taxes paid by households. The data indicates that, overall, all non-white ethnic groups were net beneficiaries in terms of benefits received and taxes paid. Specifically, Black ethnic groups received the highest amount in benefits (£15,500) and paid the least amount in taxes (£9,100), which likely reflects the relatively lower employment rates among these ethnic groups.
The report also included a separate cohort of "recent arrivals," which accounted for migrants who arrived after the year 2000. The authors concluded that migrants who arrived between 2001 and 2011 had a positive impact on the economy during that time period. Unsurprisingly, this finding garnered more attention in the mainstream media compared to the overall cost of £114 million over the period from 1995 to 2011. However, it is important to consider this claim in context. The positive contribution observed over the 10-year period only takes into account the prime years of economic productivity, as the average age of a "recent arrival" is 26 years old. Moreover, the analysis does not account for future welfare costs. It is worth noting that the economic burden tends to be highest among the elderly, primarily due to pension and healthcare costs.

Other reports adopt novel methodologies in order to spin positive conclusions from the non-EEA migrant cohort. While a paper from Oxford Economics acknowledges that non-EEA migrants presented a net fiscal deficit in their static analysis, their ‘dynamic’ analysis suggests they will be a fiscal asset. How? By counting their children as natives and by claiming a large share will move back to their country of origin. Using IPS data, they calculated the attrition rate of migrants, however this data isn’t stratified into EEA and non-EEA classes. Another report provided more light on this factor;
Judging by observed migration flows, many EEA immigrants will return home before either point is reached, whereas most immigrants from the poorer members of the non-EEA grouping will remain permanently in the UK. The disparity between inflows and outflows was greatest for the mostly poor countries in the columns labelled ‘New Commonwealth’ (mainly countries in South Asia and Africa) and ‘Other Foreign’
This challenges the ‘dynamic analysis’ methodology from the Oxford Economic report regarding their conclusion that non-EEA migrants will likely return to their native countries - this is also supported by data from Norway.
Immigrants from countries with similar income levels as Norway tend to perform well in the Norwegian labor market, and on par with natives. A relatively low fraction of these immigrants settle permanently, however. Conversely, labor immigrants from low‐income developing countries tend to stay over the long haul and have high risks of non‐employment and social insurance dependency
It is observed that migrants from Australia, New Zealand, and the EU exhibit higher employment rates compared to natives, whereas those from Africa (excluding South Africa) and Pakistan/Bangladesh have significantly lower employment rates, with only 54.7 percent and 48.9 percent respectively. Government data shows that no migrant group has higher employment rates than the native population.

Of particular concern is the finding that only 19.8 percent of Muslims aged between 16 and 74 are engaged in full-time employment. These findings indicate that economically productive migrants are more inclined to return to their home countries, while those who are less economically productive are less likely to do so.
The impact of immigration on the labour market has been studied by the Migration Advisory Committee, which concluded that it affects wage distribution. Their research indicates that migration tends to increase wages at the higher end of the distribution while reducing wages at the lower end. Additionally, studies have shown that a majority of new jobs were obtained by migrants, and one report estimated that for the period from 1995 to 2010, an increase of 100 foreign-born working-age migrants in the UK corresponded to a reduction of 23 native individuals employed. A House of Lords report supported these findings, noting that the fiscal impact of immigration is relatively small in relation to GDP and cannot be used to justify large-scale immigration.
10.France
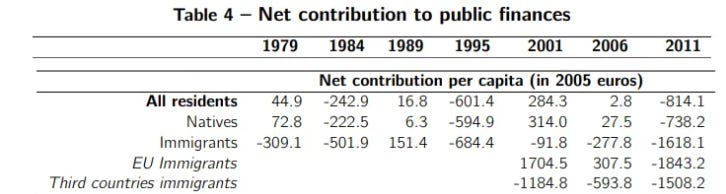
A study from France shows that the net contribution of immigrants is overall negative for the period between 1979 and 2011, costing the French economy 0.5 percent of its GDP when adopting an individual approach (this classifies children born in France but living in immigrant households and mixed households were classified as natives). The authors note that by using this approach, the results are considerably more favourable for the migrant group. Nevertheless, natives consistently make larger contributions over the 30-year timeframe.

When adopting a household-based approach that incorporates second-generation migrants, we observe that the economic contribution of immigrants fluctuates within the range of -1 percent to -1.65 percent of France's GDP. In this scenario, the negative contribution of immigrants is the reason for the French primary deficit of 1984. When second generation children under 16 are included, the net contribution of the immigrant population results strongly negative for all years. While in the baseline scenario, the net contribution varies between €0.62 billion in 1989 and -€8.8 billion in 2011, it consistently remains below -€12.8 billion in the second-generation scenario, nearly approaching -€30 billion in 2011.
The findings align with those of previous studies, revealing a substantial disparity in performance between EEA and non-EEA migrants. For instance, in 2001, EEA migrants made a positive contribution of +€2.8 billion, while non-EEA migrants contributed a deficit of -€3.2 billion.
11.Conclusion
As demonstrated in this article, the consequences of large-scale immigration are largely negative for the existing populations in European countries. While migrants from regions like Northern Europe, Northern America, Oceania and the Far-East generate a fiscal surplus, migrants from Africa, the Middle-East and South Asia negatively impact the host nation’s economy. Understanding the motives of Europe’s heads of government which have encouraged mass-immigration from regions that produce negative economic contributions is difficult to comprehend and a drastic revision to Europe’s immigration policy is needed if Europe wishes to thrive economically
This needs to be shared far and wide.
I think you've misunderstood your own studies that you've linked because you seem to be arguing that studies that attribute the children of immigrants to natives as being some kind of flaw in any study. In fact, most of the studies that you seem to provide for the UK only attribute the children of immigrants to native workers when they become adults i.e. the time period when they are the most beneficial. This is the static analysis that you seem to be heavily relying upon for any conclusion.
Take your Oxford Economics paper as well as the paper you've provided by Dustmann & Frattini. Their static analysis attributes the costs of raising an immigrant's child to adulthood but then assign the benefits of being a worker to the native themselves. This will naturally over-estimate costs pretty significantly which is why dynamic analysis aims to control for this. Even Dustmann & Frattini themselves acknowledge this massive flaw in their own study.
>The data indicates that, overall, all non-white ethnic groups were net beneficiaries in terms of benefits received and taxes paid. Specifically, Black ethnic groups received the highest amount in benefits (£15,500) and paid the least amount in taxes (£9,100), which likely reflects the relatively lower employment rates among these ethnic groups.
That's not true at all. The largest ethnic minority group in the UK ('Asian') paid around £500 according to the ONS. But this fundamentally misunderstands what this statistic actually means - if you have children for example and send them to school, they will be costs on the household ('benefits-in-kind'). All this is going to be heavily influenced by the fact that ethnic minorities are younger so they tend to have young children which is going to be heavily penalized in any kind of 'net payments' benefit. The ONS also doesn't include things like the state pension which will be drawn by disproportionately white adults in this figure for net costs which is actually a massive cost and not something that has been paid for.
The paper you linked by Dustmann & Frattini doesn't even say that foreign labour takes up jobs from native workers. This is something you seem to have concocted - they in fact argue the opposite on page 17. They point out that the number of jobs has grown greater than the number of immigrants. I'm not even sure where you got this absurd statistic involving 23 native workers from. I've quoted the relevant paragraph below - they're making the opposite case than you think here.
>Rather, the numbers suggest that employment has increased even more than population
growth through immigration: between 1995 and 2011, the total adult UK population (including immigrants) increased by 11.1% and the total working age (16–65) population increased by 10.2%, while the total number of jobs increased by 12.8%
It feels like you've not properly understood the studies you've linked either because you seem to have read them rather superficially. Because to argue that treating the children of immigrants as natives as misleading in any paper shows you've not really understood how the static analysis works. It's quite the opposite because otherwise, any static analysis would assign the benefits of immigrants being workers while assigning the costs to natives.
I'm from the UK so I won't comment on other countries but we should never be using studies from other countries to somehow argue something about the UK. This violates the basic principle of ceteris paribus. I wouldn't even normally comment on something like this but the fact that you seem to fundamentally misunderstand the papers you've linked, what the static analysis actually does, and then you've written quite bold pieces that aren't supported by the papers made me a little annoyed.